Polymer & Co.
DSC
What is a DSC ?
Differential Scanning Calorimetry, or DSC, is a technique used to study the behavior of materials as a function of temperature. It measures the energy absorbed or released by a sample as it is heated or cooled.
A schematic diagram of a typical DSC is depicted in Figure 1. The heat flow from the heaters to the sample is measured relative to the heat flow to a reference material. Generally the sample is placed in a crucible or a pan which sits close to a sensor. The reference which has a well-defined heat capacity is also put in a strictly identical environment. Both the sample and reference crucibles are surrounded by a furnace which constantly monitors the heat flow rate to keep the temperature of the two crucibles equals. Indeed, the sensors are able to detect the thermal changes that could occur in the sample. So the system can supply or evacuate heat to compensate these changes and thus to stay at the same temperature than the reference. This allows us to determine the heat capacity of the sample. [1]

Figure 1 : Schematic diagram of a DSC [1]
During the experiment, the sample might also undergo phase transitions or chemical reactions. These will be translated as peaks on the DSC curve. The area of the peak corresponds to the enthalpy involved in the process. Therefore we can distinguish exothermic or endothermic process depending on the orientation of the peak.
A schematic DSC curve represented in Figure 2 shows typical thermal effects when a semi-crystalline polymer is heated. This includes glass transition, crystallization, melting and finally thermal degradation.
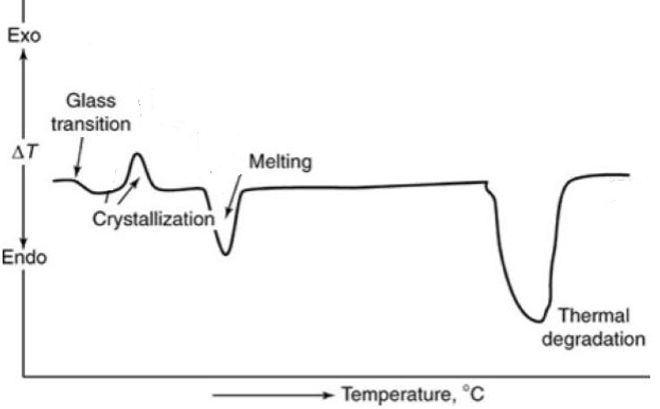
Figure 2 : Schematic DSC curves showing different transitions and reactions of a polymer. [2]
Results
In our project, a sample of each polymer ranging from 4 to 8 mg was placed in an aluminium pan. We performed a first heating to erase all the history of the polymer that could influence the result. Then the samples were cooled to ambient temperature to finally be reheated. All the curves were performed at a rate of 10°C per minute. Ultimately we measured at the end of the experiment the masses of the samples to detect potential chemical reactions that could occur during the DSC. The complete analysis of the DSC curves can be found here for the Nylon 230 and there for nGen_Flex.
For the Nylon 230, we can see on the image below that the melting point is around 208 °C.

Figure 4 : Result of the DSC experiment for Nylon 230 : In black the 1st heating curve, in green the 2nd heating curve and in blue the cooling curve
As depicted in the Figure 5, the nGen_Flex melts at 210°C.

Figure 5 : Result of the DSC experiment for nGen_Flex
This experiment shows that both polymers can withstand 120°C as they both melt above 200°C. The results of the DMA experiment (here) give information about the mechanical properties of these polymers at this temperature.
By Alexis
Bibliography
[1] "Schematic diagram of a DSC", http://nptel.ac.in/courses/115103030/module4/lec22/2.html
[2] Chartoff, R., & Sircar, A. (2005). Thermal analysis of polymers. Thermal Analysis of Polymers. Retrieved from http://onlinelibrary.wiley.com/doi/10.1002/0471440264.pst367/full