Polymer & Co.
DMA


Introduction
Dynamic Mechanical Analysis (DMA) is a technique used to measure mechanical and viscoelastic properties of materials as a function of temperature, time and frequency while it is being subjected to an oscillating stress.
Types of materials analysis by DMA
Applications
Stability testing, damage and failure assessment, usability tests, and materials characterization.
Thermoplastic, thermosets, elastomers, adhesives, metals, composites, paints, films and fibers, construction materials, pharmaceutical, and foodstuff.


Goals
In the framework of our project, the DMA will be useful to deepen the results related to the thermal transitions obtained previously by DSC (Tm, Tg and more), as well as to obtain new information about the mechanical properties under operating temperature, 25 – 120ºC (mechanical modulus).
materials & methods
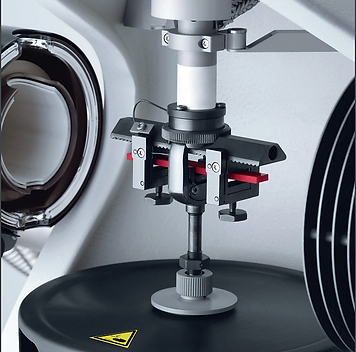
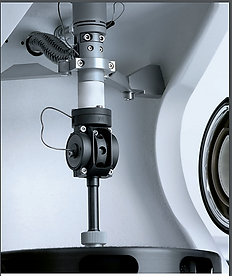
To perform the DMA experiments a Mettler Toledo – DMT861 machine was used.
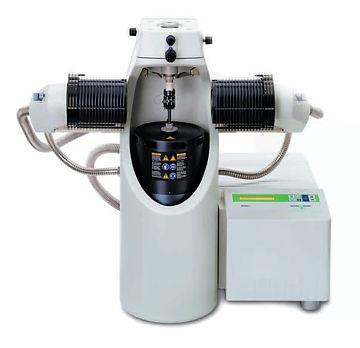
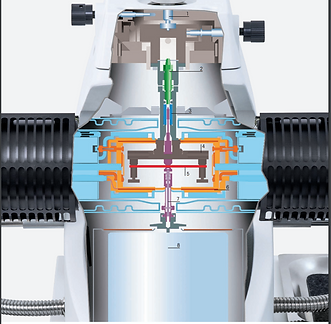
Main components:
-
4 – axis alignment (x/y, α/β)
-
Piezoelectric force measurement sensor
-
LVDT Electromechanical displacement sensor (precision: 1 μm)
-
Clamp
-
Sample (here in Dual Cantilever Bending Mode)
-
Furnace
-
Drive Shaft
-
Linear Motor
To measure the temperature, three thermocouples are used. They are placed in the sample clamp, in the drive shaft (reported temperature) and in the liquid nitrogen tank.
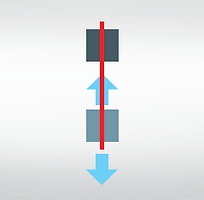
This equipment allows for measurements using various stress modes according to the characteristics of the sample to be analyzed. Tension deformation mode was chosen to perform our experiment.
Applicability of Tension mode:
Tension is the mode most suitable for films, fibers and thin bars and rods. The advantage is that sample clamping hardly affects the deformation.
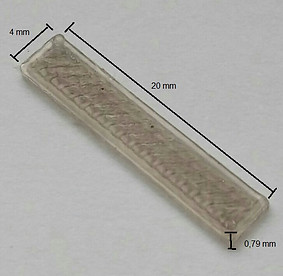
Sample
The samples were printed in Nylon 230 and nGen_Flex using the standard specifications of temperature, 100% infill, and a reduced extruder speed of 30 m/s
Fixation
In tension mode, one end of the sample is fixed and the other is subjected to an oscillatory force, the standard distance between the two clamps that hold the ends is 9 mm in rest mode. The sample must be pre-stressed to prevent compression stress from causing buckling during the oscillatory movement, an offset of 3N was applied with this purpose.
Experimental setup
The strain and stress applied during the deformation cycles should not deform permanently the samples, i.e. they must remain in the elastic region that has to be set by the user. To determine the range of the elastic deformation region, a strain-stress sweep was performed at room temperature and constant deformation frequency of 1Hz, which led to a setup to be applied of 8 μm and 0.2 N of maximum displacement and force respectively (those values were chosen such that it was suitable for both materials without loss of generality).
The experiment starts in displacement control and switches to stress control after the glass transition.
Temperature Range:
nGen_Flex:
-
Tmin = -100 ºC (below Brittleness Temperature)
-
Tmax = 200 ºC (just below the Melting Temperature Peak)
Nylon 230:
-
Tmin = -100 ºC (considerably below the Glass Transition Temperature)
-
Tmax = 200 ºC (below the Melting Temperature)
Finally, a heating and cooling rate of 3 ºC/min as well as a constant oscillation frequency of 1Hz were chosen (It is important to highlight that the reproducibility of this experiment is strongly related to these last values, such that its differences with respect to the DSC analysis were attributed mainly to the difference in cooling and heating rate and the higher sensibility of the DMA machine used).
results & discussion


The results are obtained in the form of Storage Modulus (E’), Loss Modulus (E’’) and damping factor tangent (tanδ):
-
E’ accounts for the mechanical response in phase with the applied stress or strain. It represents the elastic component of the deformation, i.e. the stored energy;
-
E’’ accounts for the mechanical response 90º out of the applied stress or strain phase. It represents the deformation viscous component, i.e. the dissipated energy;
-
tanδ = E’’/E’ is increased when chains gain in mobility (the material becomes more liquid-like) and decreased when the chains mobility is restricted (the material becomes more solid-like).
Some characteristic behaviors are seen for all the three properties measured during a transition that results in change mobility change.
The rearrangement of chains results in a peak of energy dissipation, which is seen as a peak in E’’ and tanδ. There is also a change in the slope of E’ as a function of temperature which, below melting, becomes smaller if the chain mobility is increasing (the elastic component starts to decrease faster) or higher if the chain mobility is decreasing (the elastic component starts to decrease in a slower fashion).
nGen_flex Results
For nGen_Flex, the DMA revealed a new information, the Tg of the soft phase, which is in between -26 ºC (considering the peak in E’’), and -5 ºC (considering the peak in tanδ). Besides, no transition is seen until Tm.
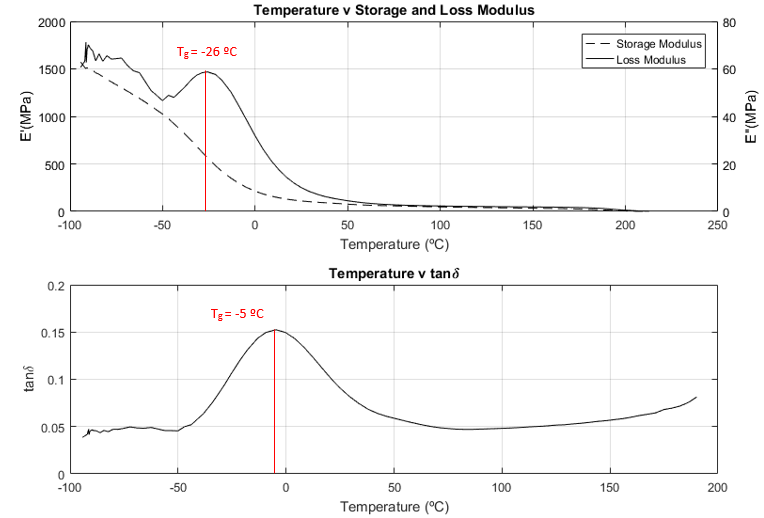
Figure 1 a) Storage Modulus (Right) and Loss Modulus as a Function of the Temperature; b) Damping modulus as a function of the temperature; Glass transition is highlighted in red
a)
b)
The transition associated with the start of the flow can be seen by the increase of the damping modulus in Figure1 b)
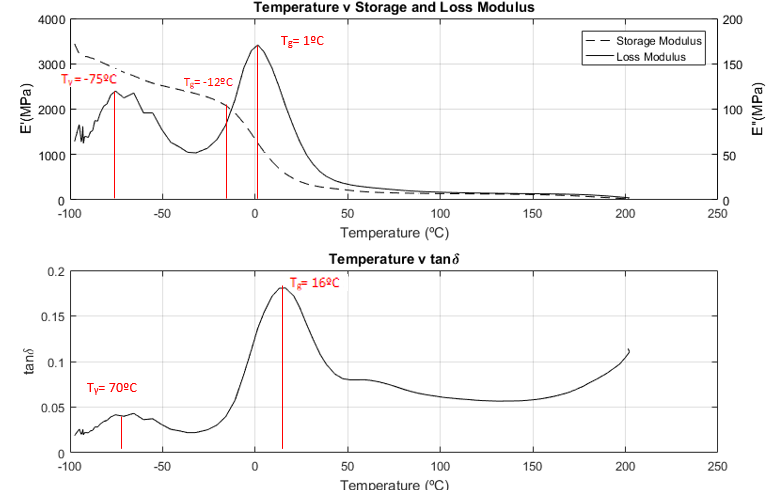
Nylon_230 Results
For Nylon 230, a considerable amount of information was obtained. First, it is possible to identify at least 2 characteristic temperatures. From other analysis it was obtained that this material is probably made of one single kind of polymer (only poliamides), that is why our hypothesis is that those temperatures are related to the rearrangement of hydrogen bonds (characteristic of nylons), and the Tg (which was found at approximately -12 ºC)
The second transition can be a Tγ. It occurs when localized bond movements (bending and stretching of bonds) and side chain movements can occur. The values found were -75 ºC (for E’’) and -70 ºC (for tanδ).
a)
b)
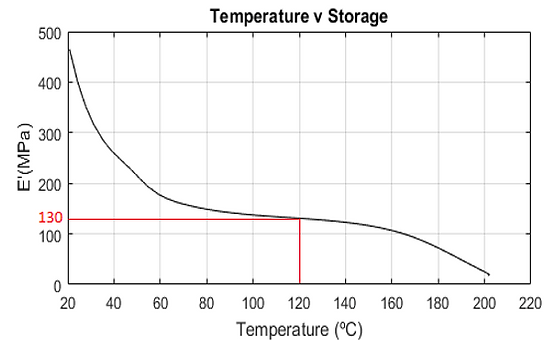
Figure 2 a) Storage Modulus (Right) and Loss Modulus as a Function of the Temperature; b) Damping modulus as a function of the temperature; Glass transition is highlighted in red
From the elastic modulus variation, we can estimate that the Nylon 230 must retain around 30% of its mechanical properties at the maximum temperature our device is designed to operate (120ºC) with respect to 20ºC.
Conclusion
The DMA provided us with plenty of new information. Now it Is possible to have a better comprehension of the transitions occurring in both materials under temperature variation. Besides that, it was possible to estimate that both Nylon 230 should retain around 30% of its mechanical properties at our maximum operating temperature with a sharper decrease from room temperature to its Tg, when it remains almost constant until 120 ºC.
By João
Bibliography
[1] METTLER TOLEDO Group - Laboratory Division, “DMA/SDTA 1+ Datasheet”, 2017, Retrieved from: https://www.mt.com/dam/Analytical/ThermalAnalysi/TA-PDF/30393591_V11.17_DMA_SDTA1_Brochure_en_LR.pdf
[2] Polymer Properties Database, “GLASS TRANSITION TEMPERATURE”, 2015, Retrieved from: http://polymerdatabase.com/polymer%20physics/GlassTransition.html