Polymer & Co.
FTIR
What is ftir ?
Fourier-transform infrared spectroscopy, or FTIR, measures the spectral signature of a material when irradiated with infrared light. The light-beam, by interacting with the atomic bonds of the molecules in sample, gives us an absorption/transmittance spectrum of the compounds associated to one particular molecular structure. Indeed, low energy photons, which can be associated to infrared light, may induce vibrational excitation of covalently bonded atoms and groups. [2]

Figure 1 : Typical FTIR instrumental process [1]
Indeed, the vibration provides a peak in the spectrum corresponding to a normal mode of vibration of the covalent bond. This latter can be visualized as a stiff spring which once it is excited, can stretch, bend and twist. An necessary condition for the transition in IR to be vibrationally activated is the variation of the electrical dipolar moment of the analyzed molecule. Molecules once excited will deform in a symmetrical/asymmetrical way and hence, if their dipolar moment thereby changes, they will be infrared active and be detected depending on their degree of symmetry. So, molecules absorb specific frequencies that are characteristic of their structure and functional groups as shown in Figure 3 . The specific absorption of light by the molecules depends on the mass of the atoms, the strength of the bonds they make and the molecules surroundings. [3]
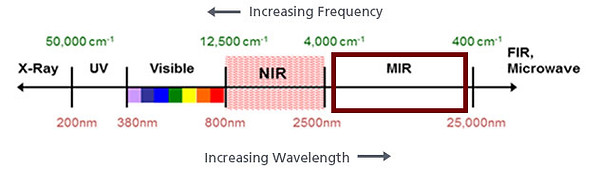
Figure 2 : Electromagnetic spectrum [4]
Shortly, the FT spectrometer by means of polychromatic waves registers matter/wave interactions at all frequencies at the same time. Thereafter the spectrum is extracted by Fourier Transform (calculated by computer that controls the instrument). [3] Peaks of absorbed light at specific frequency can be correlated to specific bonds and functional groups. It is therefore possible to identity a material, as each one has a particular set of peaks, also called their “spectral fingerprint" (or "spectral signature").
In the following Results section, the spectrum obtained for each material sample were compared with references from the literature in order to determine the different functional groups composing the polymer.
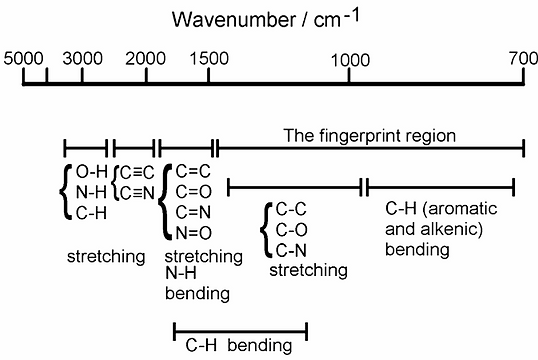
Figure 3 : IR Spectrum interpretation [3]


Results
We have performed an FTIR on our two selected materials nGen_Flex and Nylon 230. Their respective light transmittance spectra are plotted below as a function of the light wavenumber. Based on literature, the most plausible functional group has been attributed to the corresponding peak [5].
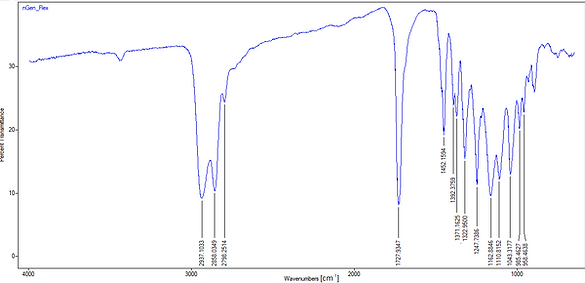
Figure 4: IR-Transmittance spectrum of nGen_Flex
In the first region of the spectrum, from 4000 to 3600 we could typically observe O-H and N-H vibrations. As shown in Figure 4, it is not the case for the nGen_flex.
Just above 3000, typically double bounds and aromatics could appear but there seems to be none in our material.
Just below 3000 cm-1, aliphatic C-H bonds are detected. For our nGen_Flex sample, two peaks are observed around 2937 and 2858 corresponding to stretching vibration of -CH2 groups and -CH3 groups .
The 1600 and 1800 region is characterized by the presence of carbonyl groups. Our sample shows a peak at 1728 specific for ester functional groups and unsaturated aliphatic parts are detected around 1162.
It's worth noticing that there are no aromatic structures shown in our spectrum.
In conclusion, we can say that nGen_Flex contains an aliphatic polyester. As the datasheet of the polymer specifies that it is a thermoplastic elastomer, we could suppose that we only detected the soft segment. In the DMA experiment (here), the Tg for the soft segment was between -26°C and -5°C. By comparing this temperature with a list of the most used polyester given by polymerdatabase.com, we obtained 2 polymers : Poly(butylene succinate) (PBS) (Tg between -32 °C and -24 °C) and Poly(hydroxybutyrate) (PHB) (Tg between -5°C and 14°C).
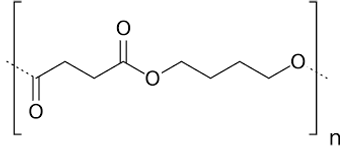
Figure 5: Poly(butylene succinate) (PBS)
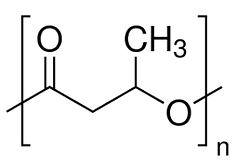
Figure 6: Poly(β-hydroxybutyrate) (PHB)

Figure 5: IR-Transmittance spectrum of Nylon 230
At 3300 cm-1, one can depict a N-H vibration on the graph. This latter is followed, at 3075 cm-1, by another peak corresponding either to N-H vibration or C-H aromatic stretch.
The peaks at 2925 and 2856 cm-1 correspond to a polymeric chain of -CH2 groups. Indeed, since we know that Nylon 230 is very similar to a secondary polyamide, its spectrum should not contain any -CH3 groups.
The 1560 cm-1 peak is characteristic of the CO-NH bond while the 1640 cm-1 one is specific for the carbonyl group.
This consecutive quadruplet (3300, 3075, 1640 and 1560) is typical of a polyamide.
Finally, by comparing our spectrum with the ones found in the literature [6], we found a good match with nylon co-polymer. However, since the structure of the different nylons is very similar, it is very hard to distinguish the different types of nylon that could constitute the material. Indeed, when comparing this spectrum with the Nylon-6, a good similarity exists except for the peak at 3075 cm-1. As previously mentioned, this latter would involve the presence of aromatics. But no conclusions could be made about these presumptions.
We can note that the copolymers PA 6.6/6 and PA 6/6.6/6.10 are by far the most commonly used in the industry.
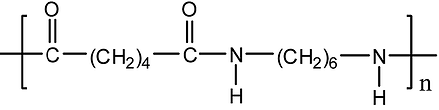
Figure 6 : PA 6.6
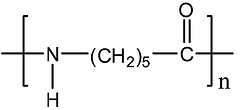
Figure 7: PA 6
By Alexis and Robin
Bibliography
[1] Smith, B. C. (1996). Introduction to Fourier Transform Infrared Spectroscopy. In Fundamentals of FTIR Spectroscopy. Retrieved from http://scholar.google.com/scholar?hl=en&btnG=Search&q=intitle:fundamentals+of+FTIR#4
[2] ThermoFischer Scientific, Introduction to FTIR spectroscopy, https://www.thermofisher.com/be/en/home/industrial/spectroscopy-elemental-isotope-analysis/spectroscopy-elemental-isotope-analysis-learning-center/molecular-spectroscopy-information/ftir-information/ftir-basics.html, consulted April 2017
[3] Lecture “LMAPR2011 - Molecular and material analysis” given by Pr. Delcorte and Pr. Hermans at Université Catholique de Louvain (UCL)
[4] "Fourier Transform Infrared for routine analysis of food and agricultural products", https://www.fossanalytics.com/en/news-articles/technologies/ftir consulted April 2017
[6] Jarrar, Rabab & Mohsin, Mahmoud & Haik, Yousef. (2012). Alteration of the Mechanical and Thermal Properties of Nylon 6 / Nylon 6.6 Blends by Nanoclay. Journal of Applied Polymer Science. 124. 1880. 10.1002/app.35215.