Polymer & Co.

Optical Microscopy
INTRODUCTION
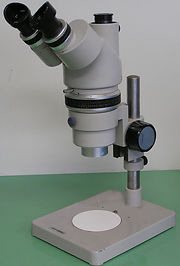
The stereo microscope was the first one used for the material analysis. This technology consists in the use of reflected light with two objective lenses for low magnification observation. Figure 1 shows an example of this kind of microscope.
Figure 1: Representation of a stereo microscope
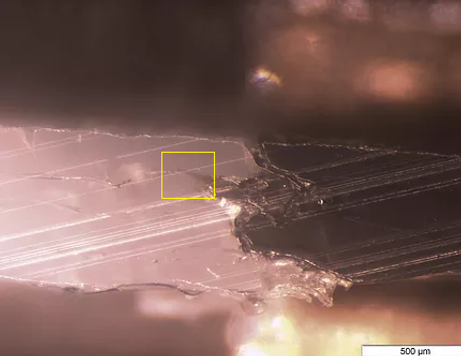
Figure 2: Capture of the interface between the Nylon 230 and the nGen Flex polymer.
The analyzed sample was produced by extrusion in a 3-D printer as a rectangle of 2mm of thickness. Half of this rectangle was composed of Nylon 230 (white) and nGen Flex (black). The sample was then cut to observe the interface between the two polymers. The results are shown in figure 2, where one can see that there is an interpenetration between the two parts. This happens, probably, because the Nylon 230 solidifies and leaves cracks in the surface behind, wherein the melted nGen can flow. We did a cut in the crack to analyze if there was nGen in there. This cut is represented by the yellow square in the figure 2.

Figure 3: Photo of a microtome
These cuts were analyzed in a compound optical microscope. This equipment is composed by a combination of objectives and eyepieces lenses and a transmitted light. The samples were prepared by cutting the piece in a thin film. The machine that cuts is called microtome and it is represented in figure 3. It consists of a blade made of diamond able to cut precisely. The cuts were done at -30ºC. In the microscopy slides preparation, oil was added to reduce diffraction. The optical microscope is represented in figure 4.
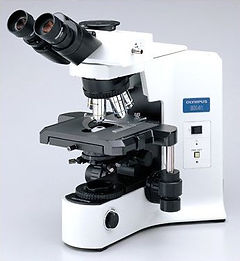
Figure 4: Example of an optical microscope
Results
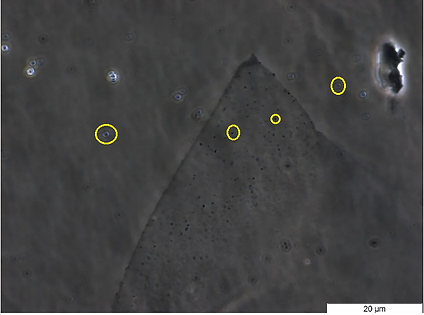
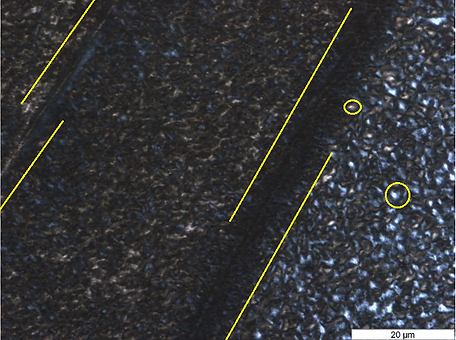
Figure 5 shows the nGen Flex and one can see blue dots representing the carbon Black. In this figure, the yellow circles show some of these carbon blacks.
Figure 5: Microscopic capture of the nGen amplification of 100x
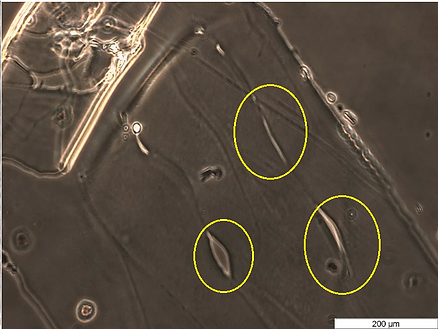
Figure 6 shows the imperfection of the additive manufacturing. One sees that there are voids in between the filaments.
Figure 6: Polymer filaments and air in between
In figure 7, using polarized light, one observes spherulites in the structure. One can also notice that in the surface, the spherulites of the nylon are smaller than in the middle of the filaments. This happens because of the differential cooling.
Figure 7: Nylon230 in polarized light
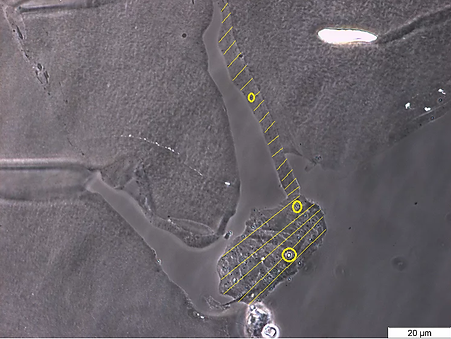
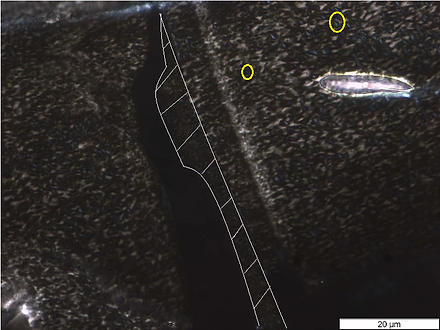
Figure 8 shows the cut in figure 1 and shows a crack in the Nylon230 and inside this crack, some nGen. The nGen is easily identified by its carbon blacks and it is represented in the hatched area. It can be observed that the crack happen in the interface, showing that the interactions between the two polymers are not strong.
Figure 8: Capture of a junction between the Nylon and the nGen 10x
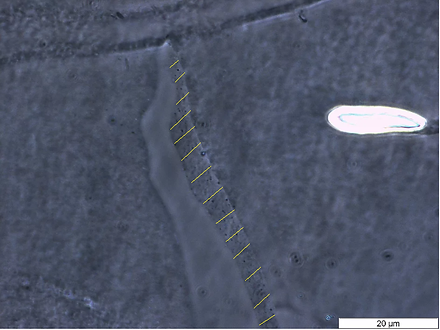
However, it can be seen that in the interface represented in the right side of figure 9 that the polymers have a proper interaction
Figure 9: Capture of a junction between the Nylon and the nGen 100x
Finally, in figure 10, one confirms by polarized light that the other phase is nylon because of its spherulites.
Figure 10: Capture of a junction between the Nylon and the nGen 100x in polarized light


CONCLUSION
With this analysis, one can conclude that the nGen contains carbon Black; that the spherulites of Nylon are smaller at the surface and larger in the interior of the filaments; that the filaments are imperfect and contain irregularities; and most importantly that even if the polymers have a proper interaction in the surface, it is a weak interaction. It can also be seen when manipulating the sample. Therefore, it is not recommended to build pieces by dual extrusion, a better option would be to separate the different polymers in different pieces and put it together like a LEGO, nuts and bolts, double cap etc.